IT ASSET MANAGEMENT
Track and manage all your IT assets in one place – saving you time and money.
Stay connected.
Stay compliant.
Get real-time updates of your IT infrastructure and automate your configuration management database. Giving you all the information you need to stay compliant and reduce costs.
Simplified management
See all your assets and contracts in one place. Making your IT processes quicker and simpler.
Increased compliance
Manage vendors, agreements and contracts – and get notified when deadlines are near.
Improved productivity
With your IT team’s workload reduced, they can focus on more important tasks to help you grow.
Over 5,000 companies trust us. Here's why:


What our ITAM
can do
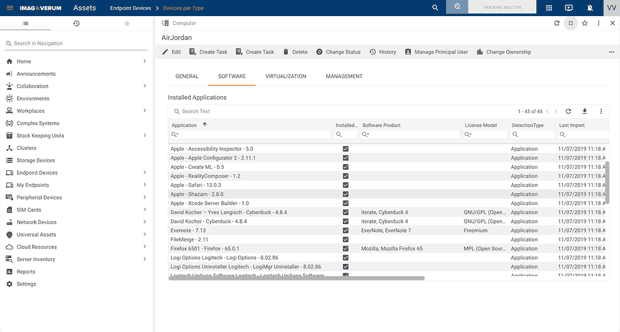
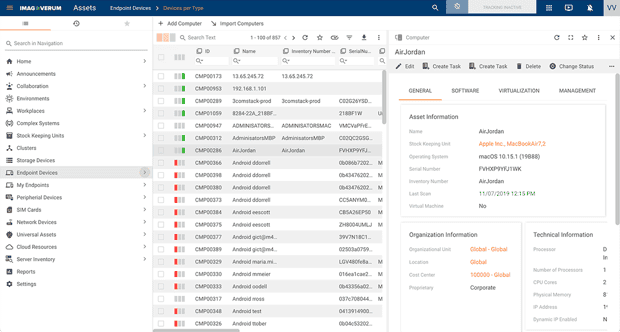
Get a clear view of all your IT assets across all of your different platforms. From hardware and software to virtual machines. It integrates with IT Service and Software Asset Management, and updates in real-time – automatically finding any new assets.
Meaning you can reduce licensing and ITAM costs, while ensuring any updates are installed by Matrix42 UEM at a time that works for you and your team. Simple and efficient. Just how it should be.

Simply manage everything – from physical to mobile devices, applications and servers.
You can see the status and configuration history for each asset. Allowing you to deploy, maintain, update or decommission IT assets whenever the time is right.

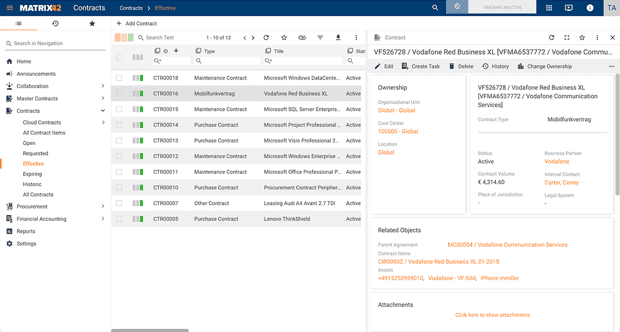
Bring all your documents and data together in one place. With automated notifications, you'll always be informed about renewals and deadlines.
Plus, with interactive reports you can analyze costs, create risk assessments and see timely information – to make sure you only pay for what you need to.

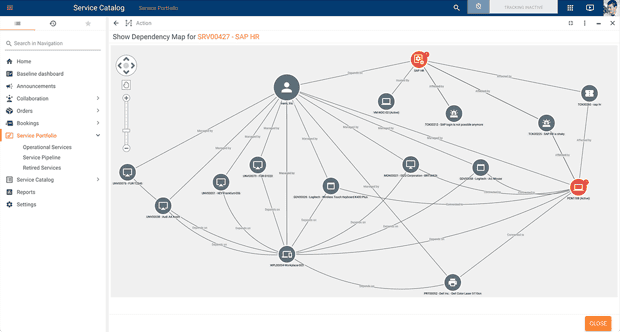
Automatically capture and map your IT landscape. It continuously collects data from your network – showing you all your IT assets and any components or services that rely on them.
You'll also be able to detect devices that shouldn't be there – and take action when needed.

Do more with
add-ons
Each of our ITAM products are available with these optional extras to help your business take control of your IT infrastructure quicker.
Premium Services
Get customized, priority 24/7 support and maintenance for your IT infrastructure. With a dedicated support person, higher SLAs and extensive maintenance services. you'll also get a product health check once a year, plus an opportunity to feedback on our product at our annual roundtable.
Discovery & Dependency Mapping
Automatically captures and monitors your IT landscape. It gives you full visibility of all your services, such as apps, network, cloud, storage, and devices. And if any changes are detected, you'll be notified right away.
Buy ITAM as part of a solution
Looking to solve more than just IT Asset Management? It's also available in the following solution.

Process Efficiency
A flexible, scalable platform that helps you raise productivity across your entire business.

Our ITAM in action
"We can map all our IT processes digitally with Matrix42, which gives us the opportunity to automate them."
Florian Hintersteininger
FAQS
How does ITAM help optimize software license management?
It automatically tracks software installations, monitors usage, and helps make sure you're fully utilizing any licenses you're paying for.
Will it support asset tracking and inventory management?
Yes. It supports both – allowing you to track their lifecycle, manage maintenance schedules, and make sure you get the most out of any devices you have.
Does it work well with other IT systems?
Yes, and it's easy to use and implement. It works seamlessly with ITSM, CMDBs and procurement systems giving you a holistic view of all your assets.
How does Matrix42 ITAM help with managing IT hardware and software contracts?
ITAM helps you track contract terms, renewal dates, and vendor agreements. It simplifies your contract management, so you always remain compliant.
Does Matrix42 ITAM offer reporting and analytics features?
Yes. You can generate pre-built reports to gain insights into things like asset utilization and hardware refresh cycles. It's all displayed on a simple, customizable dashboard, helping you analyze quickly for better business decisions.
Can Matrix42 ITAM support IT asset lifecycle planning and budgeting?
Yes. ITAM gives you visibility into the lifecycle stages of your assets, their depreciation, and lets you know when it's time to replace them. This'll help you make better decisions into which assets to invest in, you budget allocations and tech refresh cycles.
What additional features and benefits do the add-ons provide for ITAM?
By selecting add-ons, you can extend ITAM to help you solve the challenges important to you. Add premium support or automated discovery of your IT landscape.
How easy is it to extend ITAM?
It runs off our ESM Platform, which is designed to be low-code. You can simply set up connections with other products via drag and drop, and extend solutions as needed.
Do I need to know code to set up services?
No, it uses our low-code SolutionBuilder and Workflow Studio. Allowing you to set up complex UI options, quickly and simply – no programming knowledge required.
Need help with something?
5 reasons to choose Matrix42
Customer satisfaction rate
Daily users worldwide
Quicker to implement
ROI for customers that switch to our ESM Platform
Experience in Digital Workspace Management